In The Shadow of a Giant: How GOP Candidates Strategically Positioned Themselves Around Trump in the 2024 Primary.

When it comes to presidential primaries, much of the focus tends to be on what candidates say — but what about where they go, and when?
Political campaigns have always been a choreographed dance, with candidates carefully plotting where and when to make appearances. But what happens when one contestant dominates the dance floor? The 2024 Republican primary featured former President Donald Trump as the overwhelming frontrunner, creating a unique dynamic where other candidates had to make strategic decisions: should they follow in Trump’s footsteps, or deliberately chart their own path?
This article presents a data-driven analysis of how Republican presidential hopefuls positioned themselves relative to Trump throughout the primary campaign. Using a novel “shadow zone” approach, we examined 1,741 campaign events to reveal previously unseen patterns in campaign strategy and t answer a subtle but important question: Did GOP candidates follow Trump’s campaign trail to tap into his media buzz, or did they deliberately steer clear to distinguish themselves?
Defining Trump’s “Shadow Zone”
To understand how candidates positioned themselves relative to Trump, I developed a metric called the “shadow zone” — defined as any event held in the same state within three days of a Trump appearance. This creates a measurable way to determine if candidates were deliberately following Trump’s campaign trail or avoiding it.
Using campaign event data from FiveThirtyEight, covering over 1,700 GOP events from January 2023 through March 2024, I identified every event that occurred in the same state within ±3 days of a Trump appearance.
The Avoiders vs. The Followers
The data spoke clearly: some candidates deliberately followed Trump while others systematically avoided him.
Francis Suarez had the highest percentages of events in Trump’s shadow (54.5%), while Chris Christie had the lowest (22.7%).

- Shadow Seekers: Vivek Ramaswamy, Mike Pence, and Asa Hutchinson also frequently appeared in Trump’s shadow.
Ramaswamy’s approach mirrored Trump’s populist energy. Pence’s overlap may reflect an effort to stay relevant within the same voter base despite their post-White House fallout. Hutchinson, with low polling numbers, may have sought the media spillover Trump attracted. - Shadow Avoiders: Chris Christie, Tim Scott, Doug Burgum, and Will Hurd notably avoided overlapping events.
Christie, a vocal Trump critic, publicly distanced himself from Trump’s influence throughout the campaign — often in debates and national interviews, seeking to establish a contrasting identity. Scott and Burgum may have aimed to avoid direct competition or being overshadowed by Trump’s media presence, choosing quieter lanes to build their profiles. - Neutral Strategists: Nikki Haley, Ron DeSantis, and Francis Suarez showed no clear tendency either way.
Haley’s approach was adaptive — sometimes showing up near Trump, other times charting her own course.
Statistical analysis using a chi-square test (χ² = 45.229, df = 9, p-value < 0.001) confirmed that candidates’ presence in Trump’s shadow zones was not random — some deliberately sought Trump’s shadow, while others systematically avoided it., But raw percentages only tell part of the story. By examining standardized residuals from our statistical analysis, we can identify which candidates significantly deviated from expected patterns:
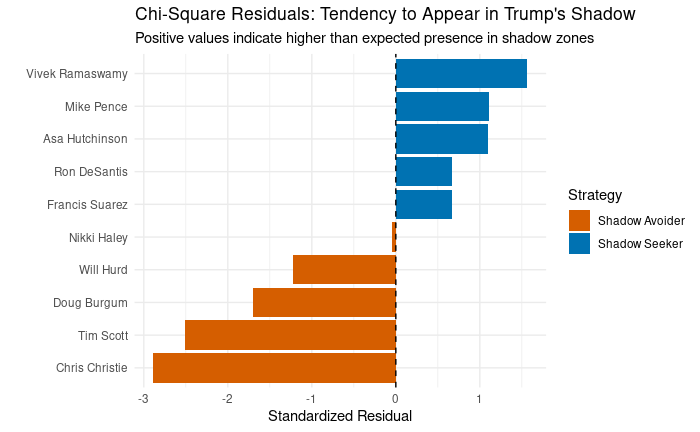
The data reveals four statistically significant “shadow avoiders”: Chris Christie (-2.89), Tim Scott (-2.51), Doug Burgum (-1.70), and Will Hurd (-1.23). These candidates deliberately stayed away from Trump’s campaign trail.
Conversely, three candidates emerge as significant “shadow seekers”: Vivek Ramaswamy (+1.57), Mike Pence (+1.11), and Asa Hutchinson (+1.10). These candidates were significantly more likely to appear in the same states as Trump within our defined time window.
While candidates publicly discussed policy differences, they never acknowledged these behind-the-scenes strategic decisions about campaign scheduling. Yet the data revealed a clear choreography — a political dance where every candidate had to decide whether to perform alongside Trump or find their own stage.
Currently as data analyst with past brand identity experience, I could see that this isn’t just about geography — it’s about identity and messaging. Avoiders wanted independence; seekers rode Trump’s media wave. Imagine it like a small bakery avoiding the same block as Starbucks vs. a food truck parking right outside. I realized campaigns were playing a high-stakes game of brand positioning.
A Frenzy of Convergence:

In early 2023, almost no candidates appeared in Trump’s shadow. By mid-year, about 40% of events fell within shadow zones. Then came the explosive January 2024 surge — when 87% of all non-Trump campaign events occurred in his shadow zones.
The January Surge:
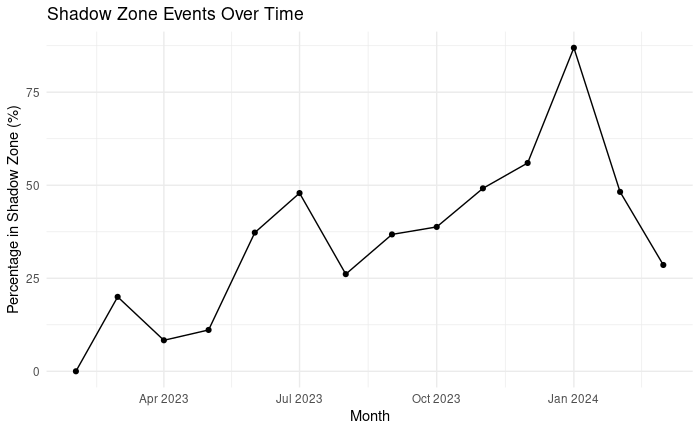
In January 2024, 87% of all non-Trump events occurred in his shadow zones — a staggering spike compared to just 20% earlier in 2023. The choreography that had been gradually building all year suddenly synchronized, Why?
- Iowa Crunch Time: With caucuses looming, candidates flooded Trump-heavy states. Even avoiders pivoted to confrontation. Nevada, another early voting state, saw similar behavior.
- Media Magnetism: Trump’s rallies drew press hordes. Seekers like Ramaswamy likely followed to grab headlines.
Think of January as Black Friday for politicians — everyone rushes to the same store, hoping to snag voters. While media coverage focused on what candidates said, this behind-the-scenes positioning strategy revealed how they actually behaved when faced with Trump’s dominant presence.
Geography of Shadow Politics
Not all states attracted the same strategic behavior.

The candidates weren’t just traveling randomly — they were making calculated decisions about where to confront Trump directly and where to establish separate territory.
- High Shadow Zones: Iowa (62.5%) and Nevada (58.3%) stood out — logical given their early primary positions and media spotlight.
- Low Shadow Zones: New Hampshire and South Carolina saw far fewer overlapping events. This may suggest candidates avoided them due to Trump’s polling strength or because local dynamics made direct overlap less effective.
This also aligns with resource-based strategy. Texas and New York, despite their size, had zero shadow overlap. That might seem surprising — but both held their primaries later (Texas on March 5, New York on April 2), by which time Trump had essentially locked the nomination.
For resource-strapped campaigns, these states were lower priority. Their expensive media markets and late timing offered less strategic return, so candidates turned to early-state momentum instead.
Event Type Matters, Too: The Resource Gap
Not only where and when, but how a candidate showed up mattered.

- High-Impact Events: Rallies and bus tours had high shadow overlap. These large-scale events likely aimed to tap into or ride the media wave created by Trump’s presence nearby.
- Lower-Profile Events: Fundraisers and tailgates were more frequently held away from Trump.
This suggests candidates weren’t just managing optics, but also controlling context —holding high-visibility events like rallies near Trump to compete for attention, while conducting fundraising activities away from his shadow to avoid competition for donor dollars. Lower-polling candidates like Francis Suarez (54.5% in shadow zones) clung to Trump’s trail, possibly to stretch limited funds by capitalizing on his events’ buzz. In contrast, well-funded candidates like Nikki Haley (44.9%) balanced shadow and independent events. Underdogs might mimic frontrunners to amplify reach — a tactic I’d use in any resource-strapped campaign.
So what? What This Means for Future Elections
Campaigns don’t announce “we’re following Trump to benefit from his media attention” or “we’re avoiding Trump to establish our own identity.” While political pundits often speculate about candidate strategies, this analysis puts real numbers behind those theories. It shows that what might seem like coincidence — two candidates holding rallies in Iowa the same week — is actually part of a sophisticated campaign calculus. These insights are useful not just to political junkies or data analysts but to any voter or observer trying to understand the deeper mechanics of campaign strategy.
These choices tell a story not just of logistics, but of identity: Who wanted to challenge Trump? Who wanted to appeal to his base without direct confrontation? And who hoped to avoid being drowned out altogether?
Implications Beyond 2024
- The Frontrunner’s Curse: Dominant candidates like Trump force rivals into binary choices: confront or evade. This dynamic will shape primaries with strong incumbents for years. Future candidates could learn from past behavior and assess risks and returns of co-locating events with frontrunners.
- Timing is Everything: My data shows late-stage convergence is inevitable. Even avoiders pivot to confrontation as voting nears.
- Shadow Zones as a Tool: Tools like shadow zone analysis could become standard for strategists plan rallies. Journalists and analysts could track “shadow zone” behavior in real-time to identify strategic shifts before campaigns acknowledge them and uncover hidden campaign strategies. For data scientists: Expand shadow zone modeling to other contexts (media mentions, social media spikes, etc.).
In politics, the loudest moments often get the spotlight — but the quiet decisions, like where and when to campaign, may say the most.
In 2024, Republican candidates weren’t just running against Trump. They were running around him, behind him, and sometimes — deliberately — not near him at all.
About the Author
Emmanuel Olimi Kasigazi is a data scientist and political storyteller based in Manhattan, New York. As a recent arrival to the American political landscape, he brings a uniquely fresh perspective to campaign analysis, unconstrained by traditional assumptions about how presidential primaries “should” operate.
Emmanuel specializes in translating complex data into meaningful narratives, an approach perfectly demonstrated in this analysis of the “shadow zone” phenomenon in the 2024 GOP primary. His background combining technical expertise with narrative insight allows him to identify patterns that might escape conventional political analysis.
A seasoned problem-solver, Emmanuel has engineered data-driven solutions for challenges ranging from nationwide advocacy campaigns to enterprise systems. This project on campaign positioning strategies represents his application of statistical rigor to reveal the unspoken chess match of presidential politics.
As Co-Creator and Host of MIT’s Chalk Radio Presents: Open Learners podcast, he amplifies voices at the intersection of open education, technology, and human-centered innovation — a commitment to accessible knowledge that extends to making political data analysis understandable to broad audiences.
His work exemplifies how fresh perspectives combined with analytical rigor can reveal new dimensions of even the most scrutinized political processes, offering valuable insights for future campaigns, political observers, and voters alike.
Explore more of Emmanuel’s projects, articles, and podcast episodes at linktr.ee/olimiemma.
Note: This analysis represents an independent research project and does not reflect the views of any political campaign or organization. The findings are presented for informational purposes to better understand primary campaign dynamics.
Limitations and Considerations
No data analysis is perfect — and this one is no exception. While the patterns uncovered here offer fresh insight into the 2024 GOP primary dynamics, there are a number of important caveats, limitations, and opportunities for further exploration:
Correlation vs. Causation: While statistical significance confirms the patterns weren’t random, we cannot definitively prove candidates were deliberately reacting to Trump’s schedule rather than responding to independent factors like debate schedules or state primary calendars.
Definition of “Shadow Zone”: Our definition (same state within 3 days) creates a binary categorization that may not capture all nuances of campaign interactions. A more granular approach considering exact geographic distances might yield different results, particularly in large states where candidates could be campaigning hundreds of miles apart yet still counted as “in shadow.”
State-Level Proximity
“Shadow zones” were defined at the state level rather than city or regional levels. While this simplification is practical, it reduces geographic precision. In large states like Texas or California, two events may be hundreds of miles apart but still counted as overlapping.
Hidden Variables: External factors such as polling numbers, fundraising success, or media coverage may have influenced both Trump and other candidates toward similar locations independently, creating apparent patterns not driven by strategic positioning.
Sample Size Considerations: Some candidates and event types have relatively small sample sizes. The perfect 100% shadow zone rates for bus tours and caucus tours (11 events each) should be interpreted cautiously, as these specialized events were concentrated during peak campaign convergence in Iowa.
Temporal Limitations: The analysis spans from January 2023 to March 2024, but campaign decisions in the pre-announcement period could provide additional context for understanding strategic positioning.
Event Classification Inconsistencies
Event types were labeled based on available public sources (e.g., campaign websites, news coverage). Different campaigns may describe similar events differently (e.g., “Town Hall” vs. “Speech”), potentially introducing inconsistency across categories
No Media or Sentiment Analysis
The motivations behind shadowing — such as capitalizing on media presence — are inferred from behavior, not measured directly. This study does not account for media coverage volume, tone, or campaign spending, all of which likely influenced decisions
Observational Study Design
This was an observational (non-experimental) study. No variables were manipulated. Therefore, while the chi-square test shows statistically significant associations, we cannot draw causal conclusions from these patterns alone
Future Research Directions
This analysis could be extended in several promising directions:
Logistic Regression Model: A multivariate logistic regression predicting shadow zone presence based on candidate identity, event type, state importance, and temporal proximity to primaries could provide more nuanced insights into what factors most strongly influenced strategic positioning.
Geospatial Analysis: Incorporating exact geographic coordinates rather than state-level matching would create a more precise shadow zone definition, potentially revealing micro-level strategic patterns.
Media Attention Analysis: Integrating data on media coverage could test whether following Trump’s shadow resulted in measurable differences in media mentions, testing the hypothesis that some candidates followed Trump to benefit from his media attention.
Polling Impact Assessment: Correlating shadow zone behavior with subsequent polling movement could assess whether strategic positioning relative to Trump had measurable impacts on candidate support.
Data and Methods
Data Source: This analysis uses data from FiveThirtyEight’s tracking of public, in-person campaign events throughout the 2024 GOP primary campaign, available at their GitHub repository. The dataset includes 1,741 campaign events from January 2023 through early March 2024.
Analysis Tools: All analyses were conducted using R (2024.12.1 Build 563) with multiple packages like tidyverse, ggplot2, stats dplyr, lubridate, and DTfor data manipulation and visualization. Statistical testing was performed using base R’s chi-square test implementation. Standardized residuals to identify significantly high or low shadow overlap by candidate. Time-series plots and bar graphs to visualize temporal and geographic patterns
Reproducibility: The complete code for this analysis is available at [https://github.com/olimiemma/The-Incumbent-s-Shadow-Analyzing-Strategic-Positioning-in-the-2024-GOP-Primary ]. This includes all data transformation steps, statistical tests, and visualization code.
Acknowledgments: This research builds on FiveThirtyEight’s data collection efforts tracking candidate movements throughout the primary campaign.


Comments
Post a Comment