Statistical Analysis in the Real World: How Education Impacts Work Hours
Statistical Analysis in the Real World: How Education Impacts Work Hours
Do people with higher levels of education work more hours? It’s a question with significant implications for career planning, economic mobility, and work-life balance decisions. Using rigorous statistical analysis techniques, we can move beyond anecdotes and explore what the data actually tells us.
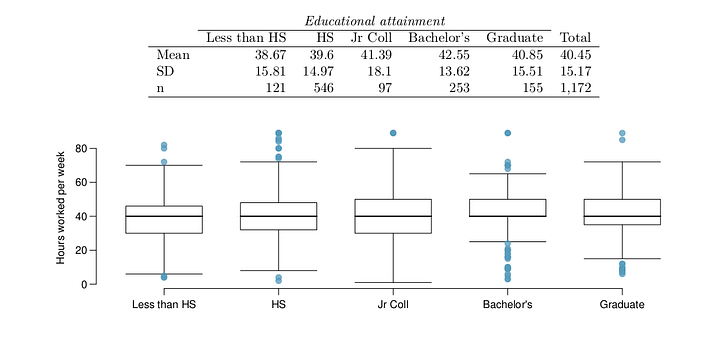
attainment and relevant summary statistics
The Data: Education and Work Hours
The General Social Survey collects comprehensive data on US residents, including their educational attainment and weekly work hours. Our analysis examined 1,172 respondents across five educational categories:

A surface-level examination of these numbers might suggest a pattern: those with Bachelor’s degrees work nearly four more hours weekly than those without high school diplomas. But is this difference statistically significant, or could it be due to random chance?
Statistical Analysis: The ANOVA Test
To answer this question, we used a one-way Analysis of Variance (ANOVA) test, which allows us to compare means across multiple groups simultaneously. Our null hypothesis stated that average work hours are equal across all educational levels, while our alternative hypothesis proposed that at least one education group differs from the others.
First, we verified that our data met the necessary conditions for an ANOVA test:
- Independence: The survey used appropriate sampling methods
- Normality: With large sample sizes in each group, the Central Limit Theorem applies
- Variance homogeneity: The standard deviations were reasonably similar across groups
- Random sampling: The GSS employs scientific sampling methods
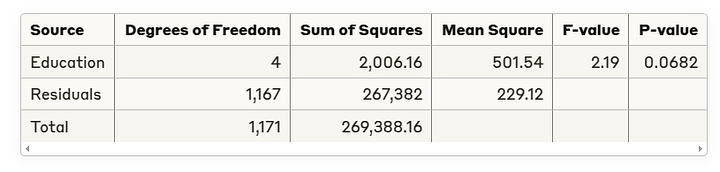
The ANOVA results revealed:
What The Results Tell Us
With a p-value of 0.0682, just above the conventional 0.05 significance threshold, we fail to reject the null hypothesis. This means that despite the apparent differences in sample means, we don’t have sufficient evidence to conclude that education level significantly impacts weekly work hours.
Beyond the P-value: What This Really Means
This statistical conclusion offers several important insights:
1. The 40-Hour Standard Transcends Education
The roughly 40-hour work week appears to be a standard that applies across educational boundaries. Whether you have a graduate degree or didn’t complete high school, the data suggests you’ll likely work approximately the same number of hours per week.
2. Quality of Work vs. Quantity
While hours worked may be similar, what differs dramatically is likely the type of work performed, compensation received, and workplace conditions. The economic returns to education manifest not in longer hours but in higher hourly compensation and potentially more fulfilling work.
3. The Marginal Effect
With a p-value of 0.0682, we’re in a statistical gray area often called “marginally significant.” This suggests there might be a small effect that our sample size wasn’t quite large enough to detect with certainty. The trend in the data — showing Bachelor’s degree holders working nearly 4 more hours than those without high school diplomas — may reflect a real but modest difference.
4. Individual Variation Matters More Than Group Averages
The substantial standard deviations (ranging from 13.62 to 18.10 hours) indicate tremendous variation within each education group. Your specific field, industry, workplace culture, and personal choices likely impact your work hours far more than your education level alone.
Practical Takeaways
This analysis offers several practical insights:
- Education decisions should consider factors beyond just work hours. The economic and career benefits of education aren’t primarily about working more hours, but rather about the quality and compensation of those hours.
- Work-life balance concerns apply across educational levels. The similarity in work hours across education groups suggests that work-life balance challenges are universal, though they may take different forms.
- Statistical nuance matters. Our conclusion changed based on where we set our significance threshold (α = 0.05 vs. α = 0.10). This reminds us that statistical analysis involves judgment calls, not just mathematical certainty.
- Individual variation exceeds group differences. The wide spread of hours worked within each education group reminds us that averages can mask individual experiences. Your specific career path matters more than broad education categories.
The Value of Statistical Thinking
This analysis demonstrates how statistical methods help us move beyond anecdotes and assumptions to understand complex social phenomena. By carefully collecting data, checking conditions, and applying appropriate tests, we can reach conclusions supported by evidence rather than intuition.
The next time you hear claims about how certain factors impact important life outcomes, ask: Does the data support this conclusion? Has a proper statistical analysis been performed? Are the differences practically significant, even if statistically detectable?
Developing this analytical mindset doesn’t require an advanced degree in statistics — just a willingness to look beyond averages, consider variation, and recognize that correlation doesn’t imply causation. These principles apply whether you’re analyzing work hours, planning your education, or making any evidence-based decision.
This analysis is based on data from the General Social Survey, which collects information on demographics, education, work, and other characteristics of US residents. The statistical techniques applied include one-way ANOVA testing with appropriate condition verification.
About the Author
Emmanuel Kasigazi combines over two decades of entrepreneurial and technical expertise as a software engineer, data analyst, and designer with a deep fascination for psychology, human behavior, philosophy and telling stories. His curiosity about intelligence and data patterns has driven his work across diverse sectors — from branding and microfinance to procurement and logistics
Emmanuel’s unique blend of real-world business acumen and analytical skills informs his approach to eduTech research, allowing him to transform complex statistical findings into meaningful insights. His passion for exploring the intersection of data science, human behavior & development and story telling also fuels his writing and podcasting work with institutions like MIT’s OpenCourseWare and Yeshiva University.
Discover more at: https://linktr.ee/olimiemma


Comments
Post a Comment